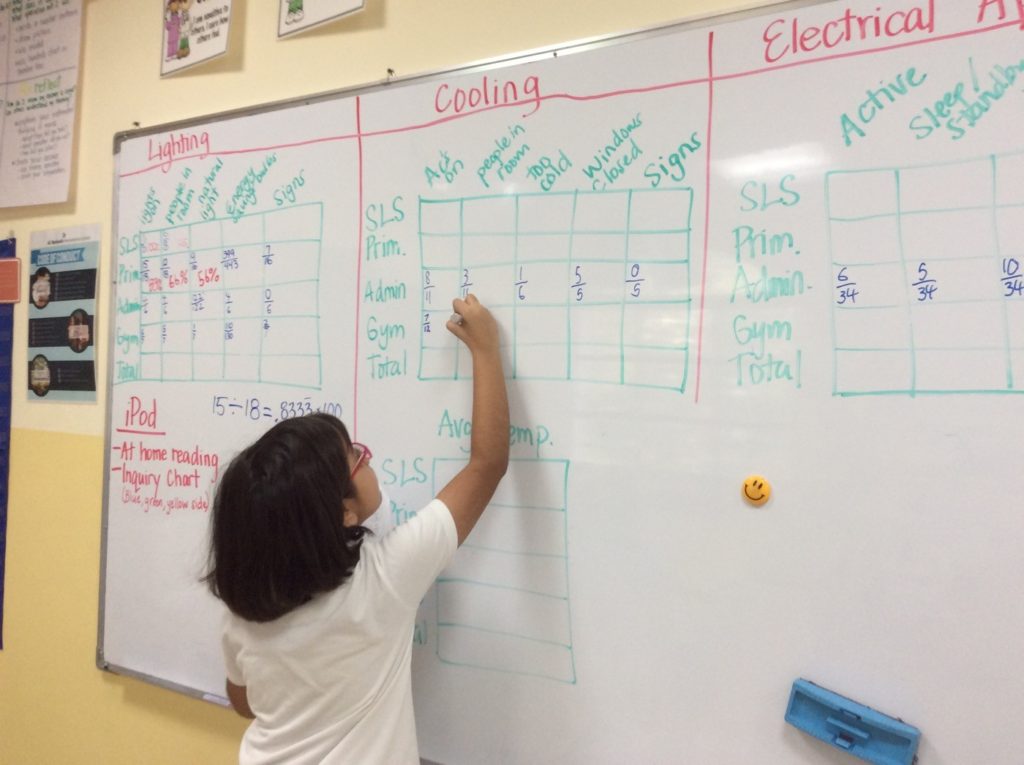
Grade 4 has been busy continuing their statistical invenstigation on energy use at ABIS. Following their school wide data collection, students sorted through the data in order to find any trends or patterns. Grade 4 used tallies to compile their observational data and and devised a system for organized it. They worked together and checked each others work to ensure accuracy. Students concluded that it was very important to record your data accurately and thoroughly during the collection phase, or the following stage would be more difficult.
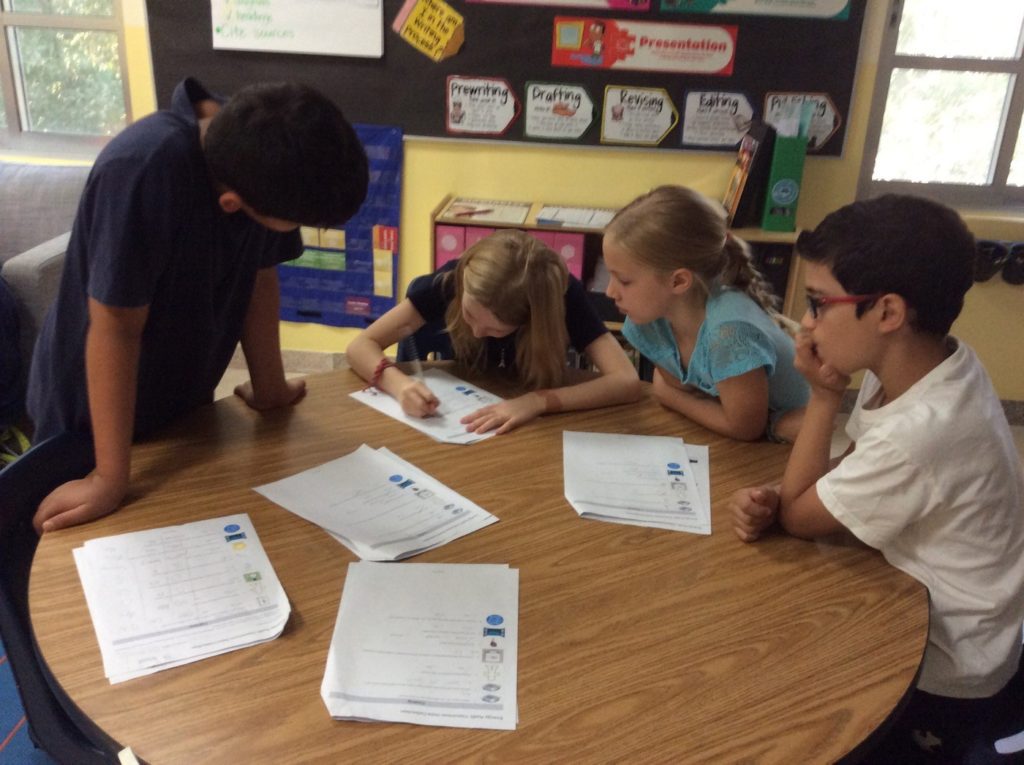
Students then recorded their totals in fractional form in a shared data table.
Following that, they needed to convert the fractional number to a percentage. We spent a great deal of time analyzing the purposes of percentages and why they can be particularly powerful in this type of statistical investigation. Students used calculator skills to compute difficult fractions that lead to division with decimals (i.e. 11/15).
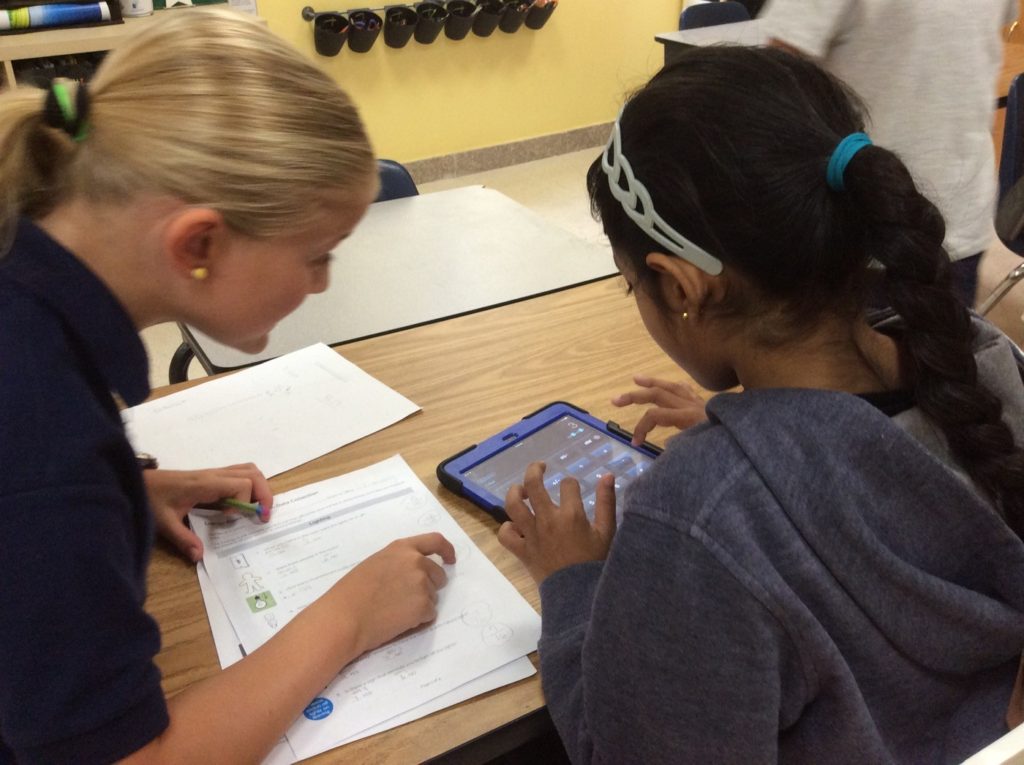
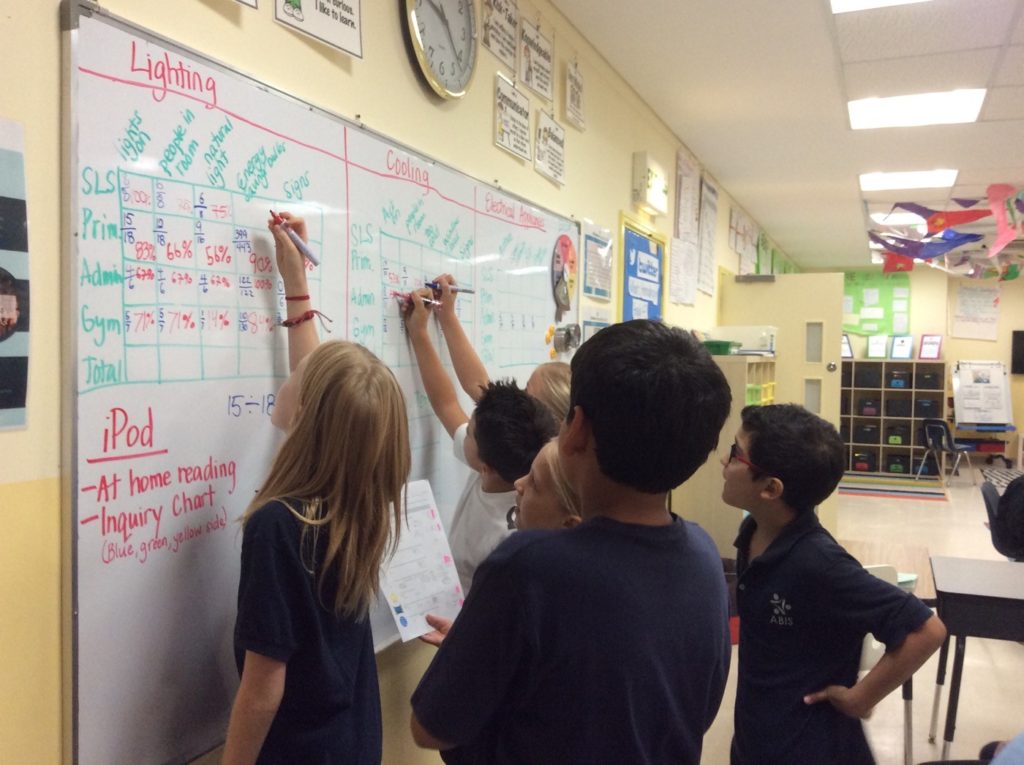
They then recorded their calculations on their shared data table. Each student was responsible for several calculations and they needed to check each others work for accuracy.
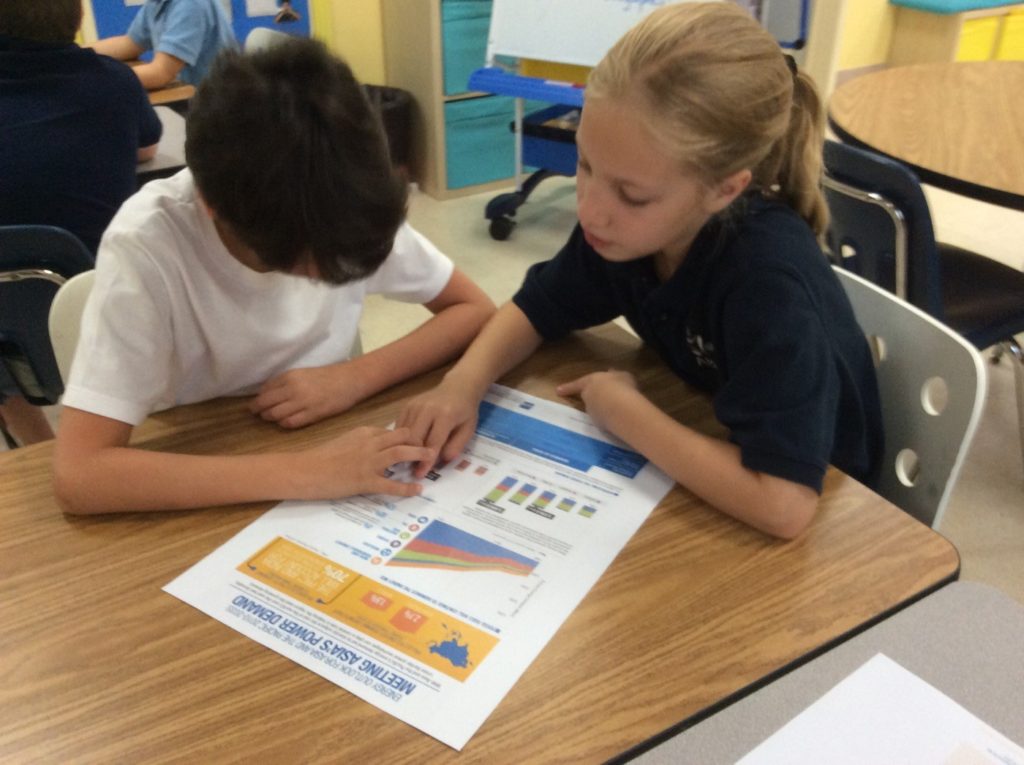
Then, Grade 4 needed to determine what graphic representation would be most appropriate to display the data. They looked at dozens of energy related infographics and analyzed their elements and purposes. We discussed and practiced strategies for reading statistical graphs, charts and tables.
Finally the time had come for everyone to make their own graphs to display their data. As a class, grade 4 decided that the most appropriate representation for this type of data was a bar graph or a pictograph. Students were able to decide which format they wanted to use and what elements needed to be included.
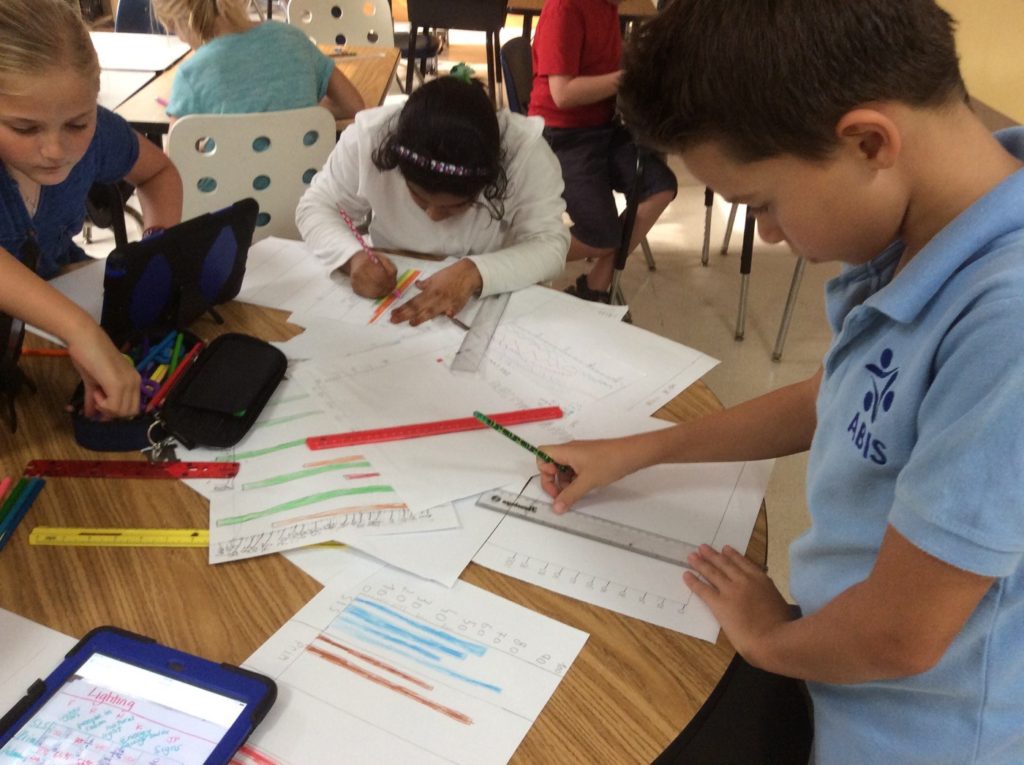
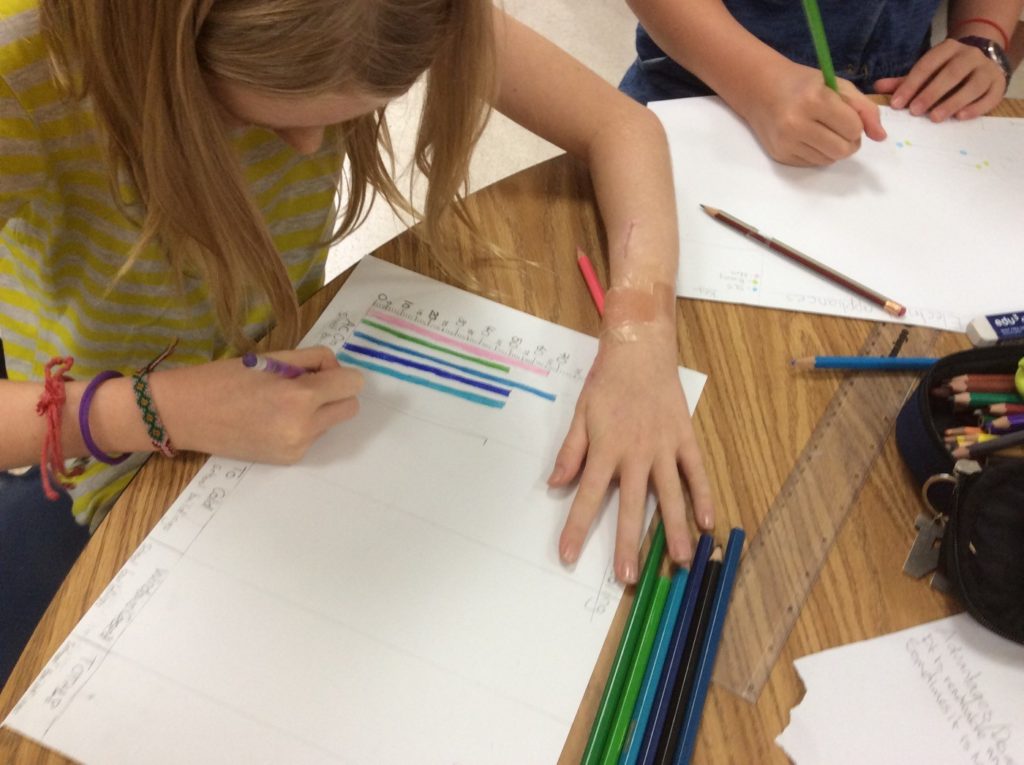
Next week, students will be drawing conclusions from their data, sharing their findings and taking action.

