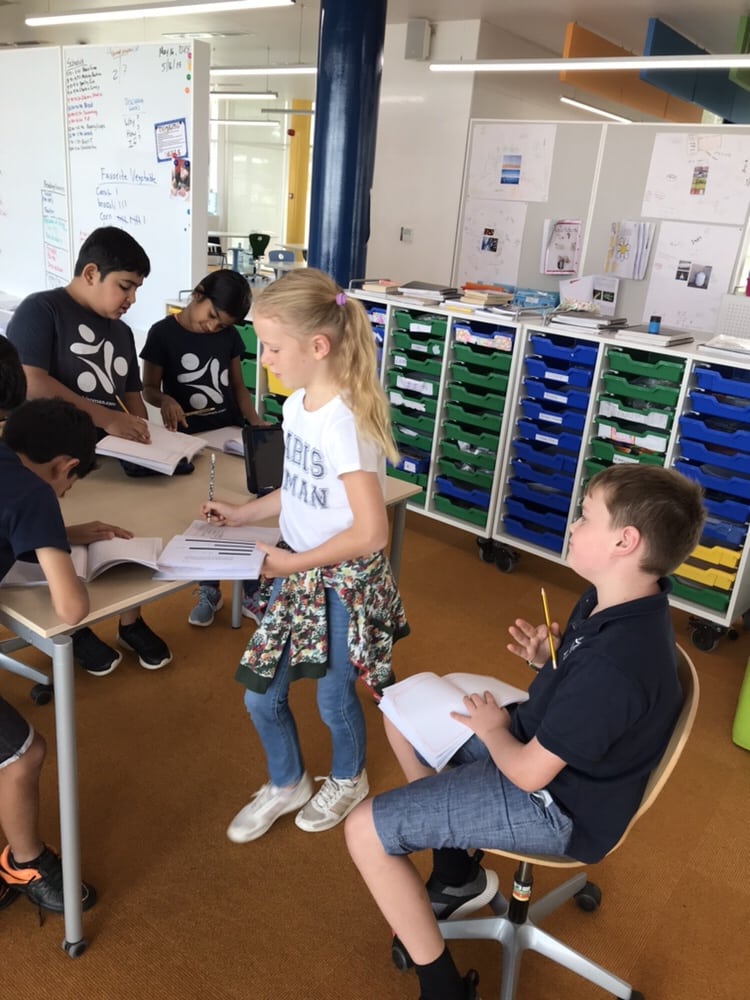
Grade four came up with survey questions in math to create a line, plot, circle, or bar graph to display their data. Students learned to use google sheets to present their findings. Grade four used their uniqueness and creativity to add different fonts, styles, and touch to graphs created.


